Have you ever wondered why your C++ program suddenly crashed or works strangely sometimes? The cause may well be uninitialized memory, buffer overflows, or use-after-free bugs, hidden bugs that can be hard to spot. Debuggers like MSVC, GCC, Valgrind, AddressSanitizer, etc. use memory patterns (i.e, 0xCD, 0xDD, 0xFE, etc) to signal where these issues are occurring. If you are not paying attention to these patterns, you might miss serious memory problems that can bring your code down.
Table of Contents:
Understanding Memory Initialization Patterns and Their Causes
When you are allocating memory using malloc and freeing it with free. In most cases, you will observe 0xCD, 0xDD, 0xCC, etc., which are given to uninitialized memory. This is used to debug the runtime libraries and help developers in flushing out the memory-related issues.
Now, let’s understand each pattern and why the compiler will initialize memory to it:
- 0xCD – Uninitialized memory (used by malloc() and new to fill uninitialized heap allocations).
- 0xDD – Released memory (used when memory is freed by free() or delete to detect access to released memory).
- 0xCC – Padding bytes in the stack (for stack corruption detection).
- 0xFD – No-man’s land (buffer overrun protection, used to protect against buffer overruns, placed both before and after dynamically allocated memory blocks).
- 0xAB – Newly allocated heap memory (used in calloc() to mean zero-initialized memory).
- 0xFE – Guard bytes inserted before and after heap blocks (helps detect overflows).
C++ Program to Demonstrate Memory Initialization Pattern Codes
Demonstrating the process of memory initialization using a simple C++ program and pattern codes. Then, it uses memset to fill the allocated space with patterns such as 0xA and prints the allocated values.
Example:
Output:
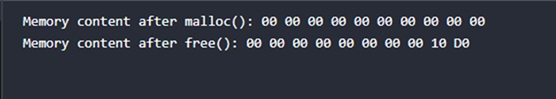
In C++, memset is often used to initialize memory with a certain pattern, like 0xAA, making sure that, during debugging/testing, memory contents are somehow predictable. Finally, it prints memory values in hexadecimal-formatted output to confirm initialization.
Step-by-Step Guide to Setting Up and Debugging Memory Initialization Patterns
Follow these 5 steps for setting up and debugging memory initialization patterns.
Step 1: Set Up the Environment
First, you need to install a C++ compiler as MSVC, GCC, or Clang, to be able to compile and debug C++ programs. Always ensure that your project is built in debug mode, such that memory patterns are similar to:
- 0xCD - heap memory that was never initialized
- 0xDD – freed memory
These memory patterns are only enabled in debug builds. The patterns are used to indicate uninitialized or deallocated memory helps to debug mode and detect memory issues.
Step 2: Configure Build Tasks
- However, in Visual Studio Code(VS Code), if a project needs to be compiled, a task needs to be created in the tasks.json file.
- Open VS Code, go to terminal —–> Configure tasks ——-> Create tasks.json and create a task which runs the g++ with the -g flag to attach debugging symbols.
- So when you hit Ctrl+Shift+B, this entire setup makes sure that your project translates into a functioning executable main.exe and can be debugged as well.
Use the below configuration:
{
"version": "2.0.0",
"tasks": [
{
"label": "Build C++",
"type": "shell",
"command": "g++",
"args": ["-g", "main.cpp", "-o", "main.exe"],
"group": {
"kind": "build",
"isDefault": true
}
}
]
}
- Save the file and close it.
Step 3: Configure the launch.json File
To enable debugging:
- Create a launch.json file in Run → Add Configuration → C++ (GDB/LLDB).
- Change it to specify the main.exe as the process name and MIMode to ”gdb” for GNU Debugger support.
- Set externalConsole to true; this will ensure output will be redirected to another console window, and then you can pause execution and see your memory state.
- Use the below configuration:
{
"version": "0.2.0",
"configurations": [
{
"name": "Debug C++",
"type": "cppdbg",
"request": "launch",
"program": "${workspaceFolder}/main.exe",
"cwd": "${workspaceFolder}",
"stopAtEntry": false,
"externalConsole": true,
"MIMode": "gdb"
}
]
}
- Save the file and close it.
Step 4: Build the Project
After we have prepared the above configuration files, we can go to the VS Code terminal and run the following command to compile the program:
g++ -g main.cpp -o main.exeThe -g flag ensures you can inspect variables and memory states as execution happens. Once that is complete, the executable line will be inside the project folder.
Step 5: Start Debugging
Press F5 to launch debug mode and open the start debug window in VS Code. Let’s say it can set breakpoints at crucial locations like allocation (malloc) and deallocation (free). Inspecting Memory in the debugger memory view while the program is running, you see padding like 0xCD (allocated uninitialized memory) or 0xDD (freed memory), which could help find potential memory corruption issues.
Benefits of Memory Pattern Initialization
- It is much easier to debug an issue where 0xCD appears than to deal with an unexplained value.
- It is useful for catching use-after-free errors to fill freed memory with 0xDD.
- 0xFD and 0xFE surround allocated blocks to find buffer overruns.
- Debugging tools such as Valgrind, AddressSanitizer, and Visual Studio Debug Heap depend on such patterns.
Conclusion
Memory initialized patterns like 0xCD, 0xDD, etc., help catch uninitialized memory access, use-after-free, and buffer overflow bugs in debug mode. These patterns make it much easier to debug your programs because they will provide predictable states in memory rather than undefined behavior. Memory safety is also improved in C++ programs using GDB or AddressSanitizer, or Valgrind.
You can learn more about C++ in the C++ article, and also explore C++ Interview Questions prepared by industry experts.
FAQs
1. Why does malloc/new initialize memory with 0xCD?
In debug mode, the value will be 0xCD, which detects a memory issue where uninitialized heap memory is being used.
2. What does 0xDD mean in memory debugging?
0xDD marks freed the memory and catches the use-after-free bugs.
3. Does release mode use these memory patterns?
No, these patterns are only in the debug part; No memory is initialized in the release part.
4. How can I check memory patterns in my program?
Use GDB, AddressSanitizer, and Visual Studio Debug Heap to inspect memory states.
5. How do I disable debug memory initialization in Visual Studio?
Use _CrtSetDbgFlag(_CRTDBG_ALLOC_MEM_DF & ~_CRTDBG_CHECK_ALWAYS_DF);.