Believe it or not, revenue forecasting was a pretty central part of my childhood, and not in a high-stakes-lemonade-stand kind of way. I was great at saving my money. I knew that most of my income would come from birthdays and Christmases, so I’d actually plot out in a notebook how much money I thought I’d have one, two, or even three years from now. My goal, of course, was to buy a PlayStation.
And really, revenue forecasting is that simple at its core. But the statistical models that make it possible? Not so simple.
So let’s take a look at how revenue forecasting works, why it matters, and the software you can use to help you get your business’s version of a shiny new console.
Table of contents:
What is revenue forecasting?
Revenue forecasting means predicting a company’s future income over a set period of time using historical data, sales trends, and external factors like seasonality and economic conditions. Think of it like predicting how much rainfall an Appalachian town is going to get in the spring, except instead of rain, it’s money, and the town is a multinational corporate entity with its own football stadium.
Revenue forecasting is hugely important for budgeting and resource allocation and can have a major impact on a business’s strategic plan as they look ahead to future quarters. The key to doing it right is to use extensive data and a strong forecasting model (which I’ll get into in a bit).
Revenue forecasting vs. sales forecasting
While they might sound like two sides of the same coin, revenue forecasting takes a slightly broader view than sales forecasting: it accounts for non-sales income like recurring subscriptions, interest, licensing fees, and other streams like research grants and tax rebates.
3 revenue forecasting models
Forecasting models are what take the revenue numbers you have and turn them into the numbers you might see in the future. Without a revenue forecasting model, your 1 million-row sales data spreadsheet is just going to sit there, staring back at you while your computer chugs and wheezes.
Unless you’re a statistics wizard—and even still—you’ll want to use a tried-and-true model. These are three of the most popular options, broken down by their main use cases.
Straight-line forecast

Formula
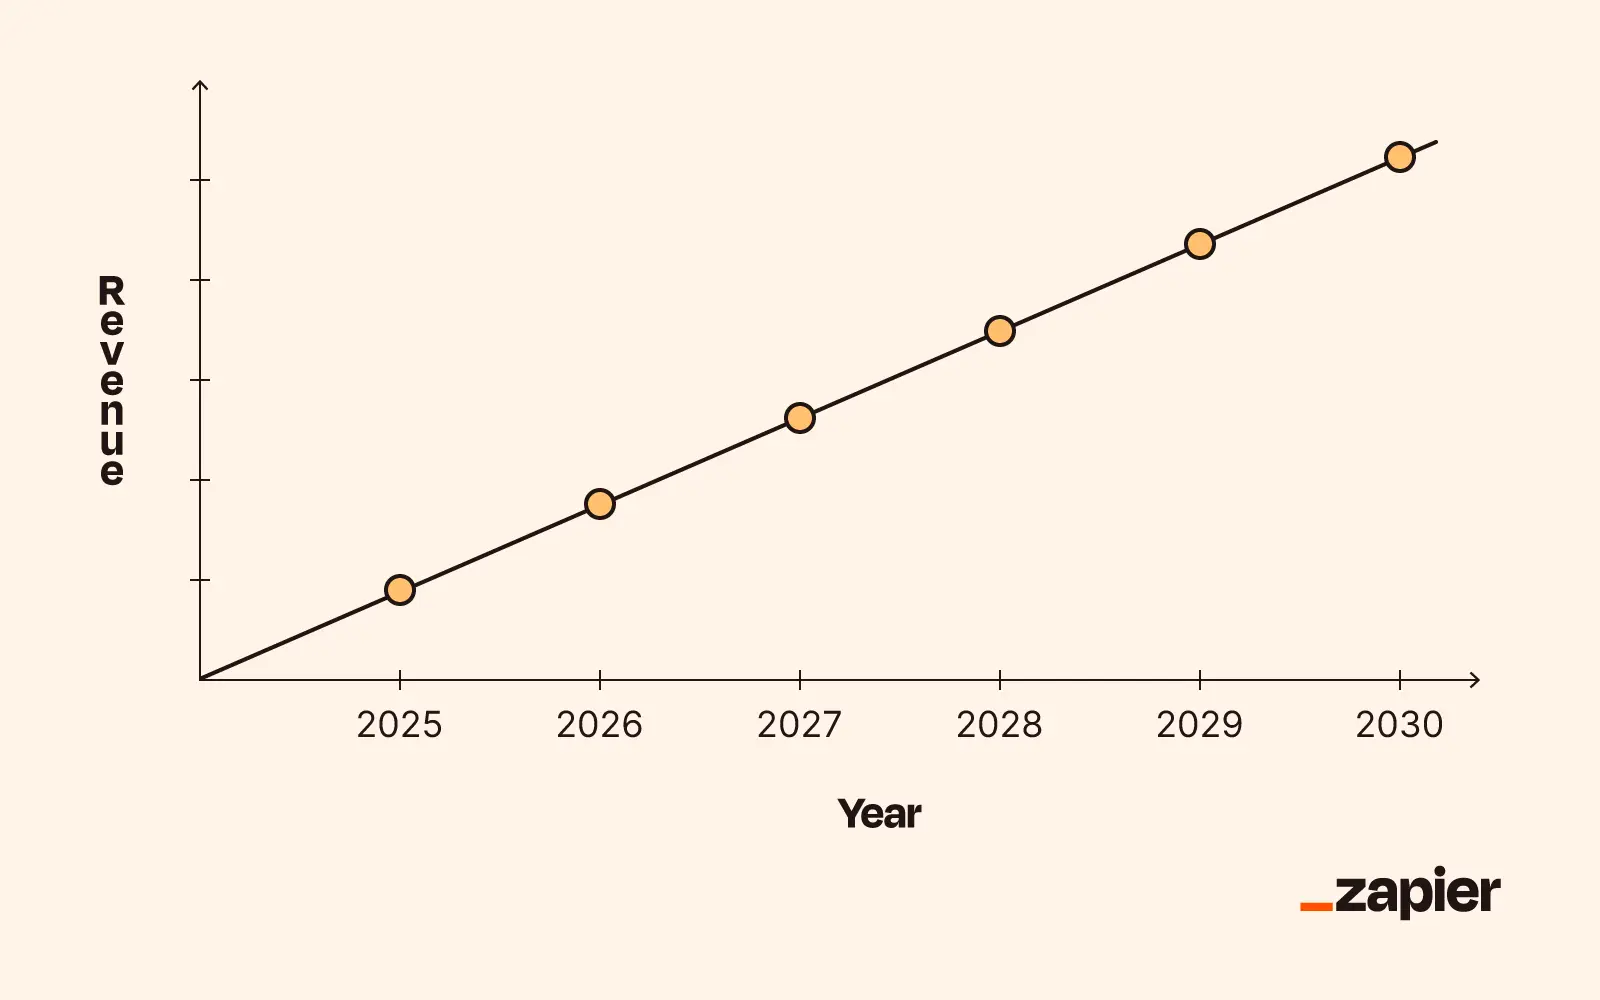
Projected revenue = current revenue × (1 + growth rate)
Best for: Simple, short-term growth projections
The straight-line forecasting method proves that revenue predictions don’t have to be rocket science, or even regular science. A straight-line forecast takes a business’s current growth rate (or the growth rate from a previous year or quarter), assumes it’ll stay fixed, and multiplies it by past revenue. That’s it.
So, if your business’s revenue last quarter was $100,000, and your growth rate during that same period was 11% (or 0.11, expressed as a decimal), you’d multiply the two and predict a total revenue of $111,000 for next quarter. If that sounds deceptively simple, that’s because it is simple—no deception. This model doesn’t account for factors like supply chain issues, market fluctuations, or the possibility that a business will stop growing at a constant rate.
Because of this, it’s best to use straight-line forecasting for short-term predictions when growth rates are historically stable—and don’t expect anything like pinpoint accuracy.
Time-series analysis

Formula
Y(t) = T(t) + S(t) + C(t) + I(t)
-
Y(t) = Observed revenue at time t
-
T(t) = Trend component (long-term direction)
-
S(t) = Seasonal component (predictable patterns)
-
C(t) = Cyclical component (irregular long-term cycles)
-
I(t) = Irregular component (random fluctuations/noise)
Best for: Complex patterns and seasonal business cycles
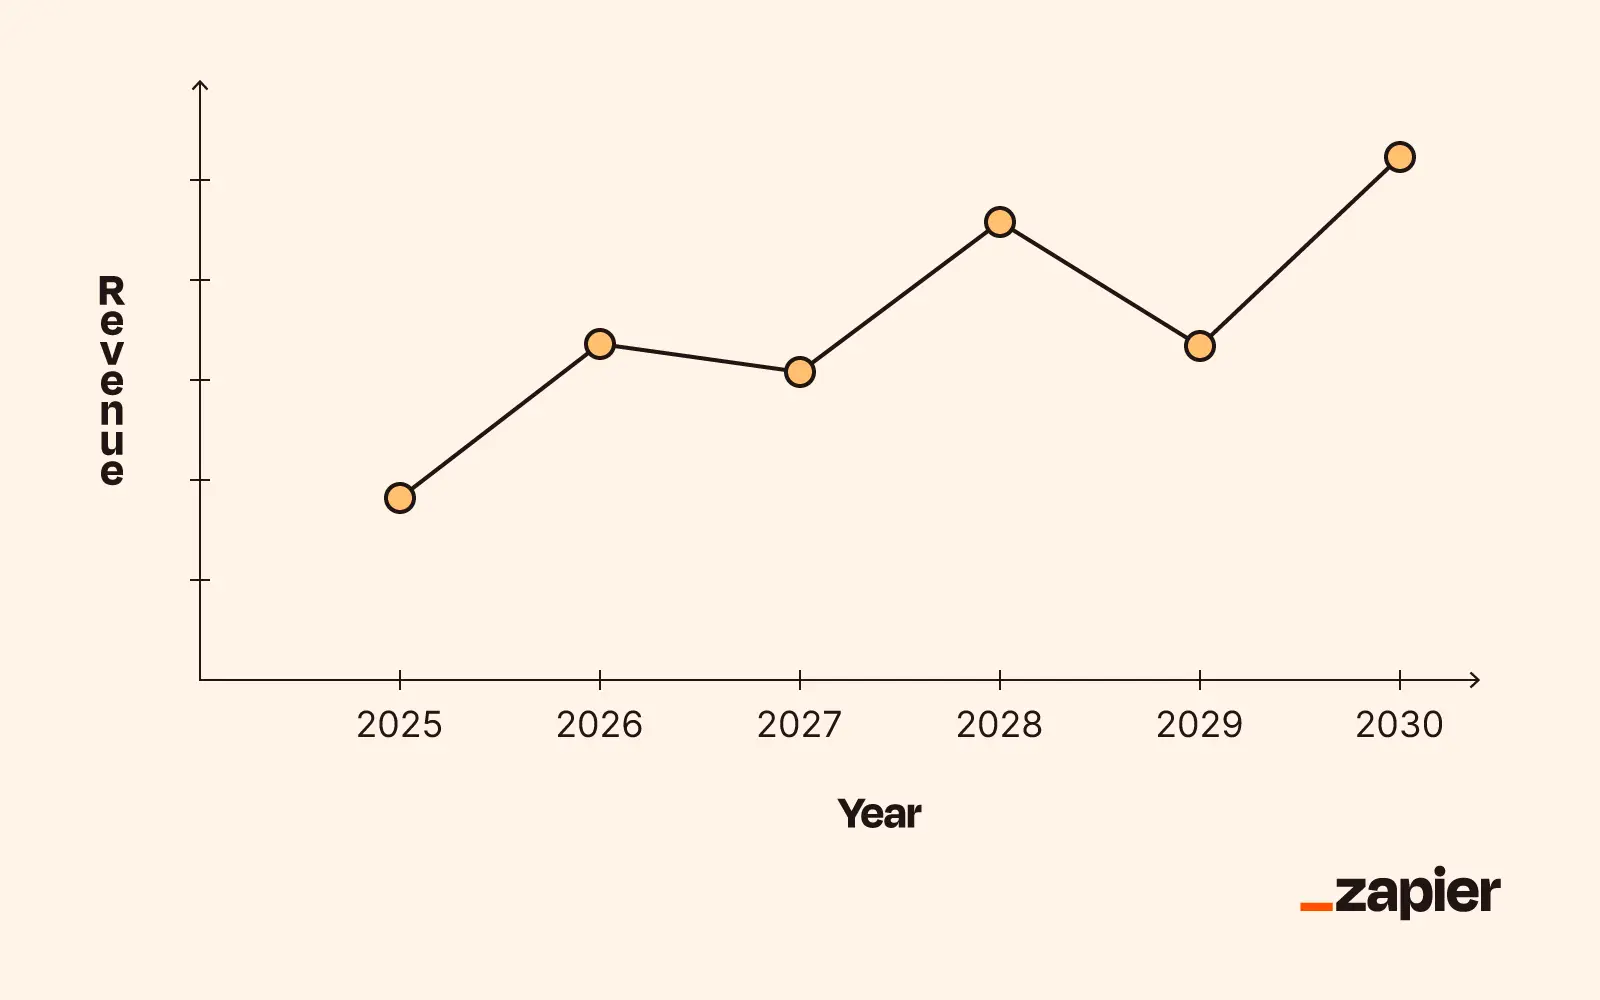
Time-series revenue forecasting seriously ramps up the complexity of the straight-line method. Instead of assuming a fixed growth rate, time-series analysis takes irregularity, fluctuations, and seasonal patterns into account.
Let’s say your open-toed shoe company’s earnings take a predictable dive in the winter, only to bounce back just as predictably in the summer. Time-series analysis takes these shifts into account and quantifies their impact on the overall data—and this goes for any kind of revenue pattern, seasonal or not (think market disruptions, competitor product launches, or viral social media trends).
This model also excels at charting long-term trends—like if a business’s revenue is up in the last year but down in the last decade—and filtering out “noise,” or random, inexplicable fluctuations. These considerations make time-series forecasts more accurate than straight-line forecasts, but you’ll need a lot more data and statistical know-how to perform them.
Linear regression analysis

Formula
Y = a + bX
-
Y = Dependent variable (predicted revenue)
-
a = Y-intercept (baseline revenue when X = 0)
-
b = Slope coefficient (change in Y for each unit change in X)
-
X = Input variable (e.g., marketing spend)
Best for: Understanding relationships between variables
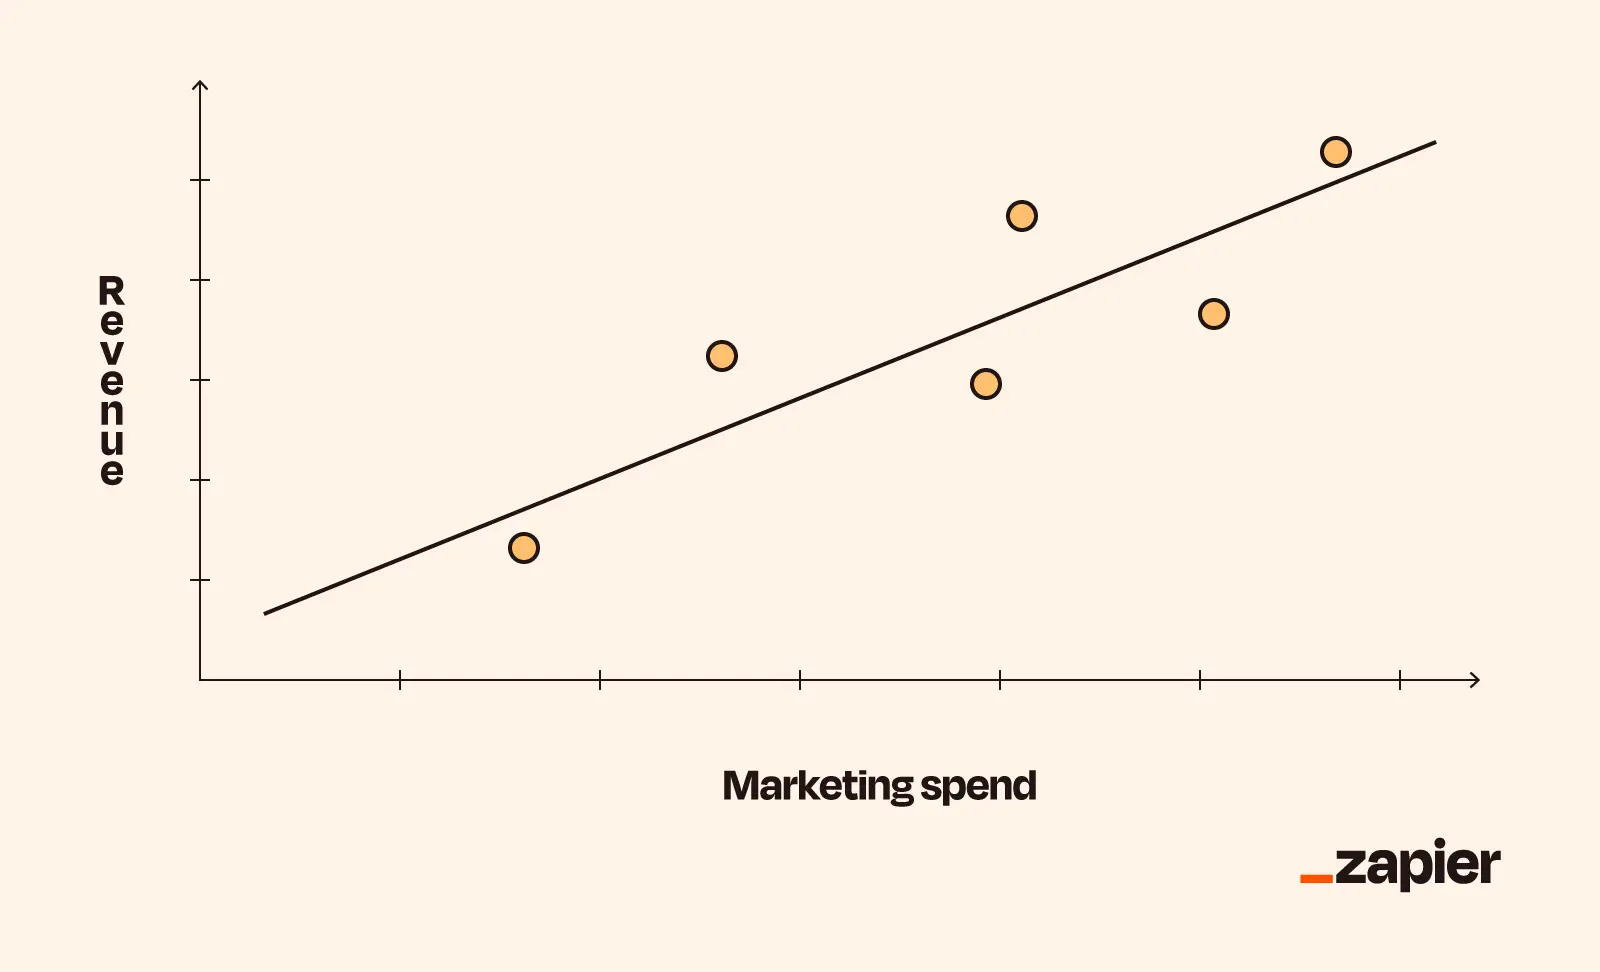
Linear regression analysis sounds very math-y, but it’s really as simple as measuring the impact of one or more variables on a target variable (like revenue) using a scatter plot. Actually, that still sounds too math-y, so let’s look at an example.
Imagine you’re a streaming giant and you want to measure the impact of your marketing strategy on your overall subscription revenue. You might assume that the more money you throw at ads, the more subscriptions you’ll get. But what about the numbers to prove it? A regression analysis will show exactly how closely these two variables—marketing spend and subscription revenue—correlate over a given period, while also letting you predict the probable effects of raising or lowering your marketing budget.
This method is great for seeing what drives revenue changes, but it’s not so great for analyzing broad historical trends or seasonality. It works best when you’re looking at cause-and-effect relationships between variables that change in predictable, linear ways.
Revenue forecasting software
Revenue forecasting isn’t something you want to do on your phone’s calculator. There are some solid manual approaches, using spreadsheet apps like Microsoft Excel or Google Sheets, but I’d much sooner recommend automated approaches, where you let software with forecasting capabilities do most of the grunt work for you.
Here are your best options:
-
Dedicated forecasting platforms: Forecasting is an industry all its own, with its own software class to boot. Sales forecasting platforms like Aviso, Avercast, and Forecastio come with advanced modeling capabilities, integration with multiple data sources, and AI-powered automations. If you want to move from basic models to seriously complex ones, a purpose-built forecasting app is your best bet. Just be aware: they cost a pretty penny.
-
Customer relationship management (CRM) software: CRMs help businesses track, manage, and analyze customer relationships. Some CRMs come equipped with built-in forecasting, while others provide you with the sales data and reports you need for forecasting with other tools. Some of the best CRMs for forecasting are Salesforce, Pipedrive, HubSpot, and Zoho, though it’s worth noting that the feature is typically limited to higher-tier plans. Still, if you’re already using a CRM and want forecasting without adding another platform, this is your most seamless option.
-
Predictive analytics tools: There’s some crossover between predictive analytics software and forecasting platforms. Predictive analytics tools are standalone apps that use machine learning and AI to automate forecasting and provide big-picture insights about your business. The main focus here is analytics, which means you’ll be digging deep into the “why” behind trends. If you need to understand the drivers behind revenue changes and want AI-powered insights beyond basic predictions, predictive analytics tools should be your go-to.
-
Business intelligence (BI) apps: Tools like Tableau, Microsoft Power BI, and Qlik aren’t actually built for forecasting, but they’re terrific for visualizing and analyzing vast amounts of business data. Some BI tools, like Zoho Analytics and Power BI, come with built-in forecasting tabs. For those that don’t, you’ll have to rely on statistical functions. These tools are best for businesses already invested in data visualization that want to add forecasting to existing BI workflows.
-
Google Sheets: You can predict revenue in Google Sheets with the FORECAST function, which uses linear regression to predict future values based on historical data. Just enter
=FORECAST(x, known_y_values, known_x_values)where x is the future period you want to predict. And if you create a chart in Sheets with your data, you can also visualize your forecasts. If you’re just starting out with forecasting or have a tight budget, Google Sheets gives you basic functionality for free. -
Microsoft Excel: Unlike Google Sheets, Excel has a built-in forecasting feature, though you can still use functions if you choose. After you enter or import two data series, highlight them and select Data > Forecast > Forecast Sheet to create a graph. You can pick between a line or column chart and customize the forecast with elements like confidence intervals and seasonality. Learn more about how to forecast in Excel.
Why is revenue forecasting important?
The value of revenue forecasting almost speaks for itself. Without a crystal ball, it’s about as close as you can get to seeing your business’s financial future.
Of course, you can’t forecast your way out of unforeseen circumstances (I’m thinking of a Skynet-style AI takeover, which, honestly, maybe isn’t so unforeseen). But, so long as market conditions remain relatively stable, you’ll be able to get a good estimate of how much money your company can expect to bring in over the coming months or years—and that enables a number of important operations.
-
Budgeting and resource allocation: Businesses don’t allocate their budgets on a day-by-day basis; they plan them well in advance. If you can estimate how much money you’re going to have in the future, you can start figuring out how (and where) you’re going to spend that money.
-
Strategic growth planning: Growth is a North Star goal for most businesses and probably your shareholders’ favorite word, but you need a strategy to make it happen. Revenue forecasting can help companies see if they’re on track to hit their five-year growth targets, and course-correct if they aren’t.
-
Cash flow management: Revenue forecasting shows your business’s sales trends and seasonal shifts, and being aware of these helps you prepare for cash flow gaps and surpluses. This could mean securing extra financing for historical slow periods or boosting inventory to take advantage of “hot” seasons.
-
Attracting investment: Investors love it when lines go up. Revenue forecasting can show whether a company’s revenue or profit line will continue going up, and when they can expect dips along the way. If you want to prove your business is worth funding, show investors your (credible) forecasting results, preferably in a neat, color-coded graph.
-
Performance monitoring: Revenue forecasting doesn’t need to be company-wide. Depending on the data you have, you could also perform forecasts based on the sales or earnings of individual departments to gauge which teams might be losing steam and which are likely to continue overperforming. Then, you can reallocate funds and employees based on your findings.
Automate your forecasting with Zapier
When it comes to revenue or sales forecasting, I have a golden rule: automate it. By removing human error from the equation, you stand a better chance of getting accurate predictions that match up with your real business performance.
If you use a CRM or other app for forecasting, that’s a step in the right direction, but Zapier will take you about a thousand steps further.
Zapier can centralize financial data from leads, sales, subscriptions, and affiliates in real time to get instant visibility into performance trends and accurate reports for faster, data-driven decisions. Automatically analyze trends and project future revenue using AI and distribute reports so teams stay informed and can act quickly on opportunities or issues. Learn more about revenue tracking and revenue reporting in Zapier, or get started now.
Zapier is the most connected AI orchestration platform—integrating with thousands of apps from partners like Google, Salesforce, and Microsoft. Use interfaces, data tables, and logic to build secure, automated, AI-powered systems for your business-critical workflows across your organization’s technology stack. Learn more.
Related reading: