Step-by-Step Procedure Example
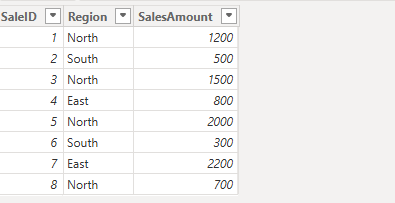
Let’s say you have a Sales table that contains the Sales amount across each region with SalesID.
Step 1: Load the Table into Power BI

This is how data looks in Power BI
Step 2: Write the DAX formula
SalesAbove1000 = CALCULATE(COUNTROWS(Sales), Sales[SalesAmount] > 1000)

Explanation:
- COUNTROWS(Sales) gives the total number of rows in the Sales table.
- Sales[SalesAmount]>1000 includes only the rows where the SalesAmount is greater than 1000.
- The resulting count of rows meeting this condition is 4.
Step 3: Result
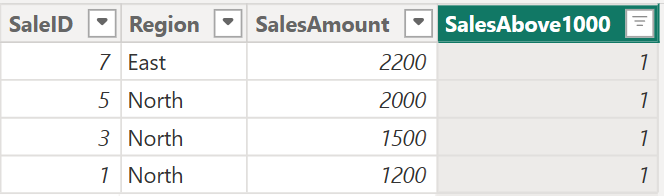
Only these 4 rows meet the specified condition.
Advanced COUNTIF with Multiple Conditions
One of the greatest things about DAX is that it is very flexible, and you can apply multiple conditions.
Example: if you want to count total sales in the “North” region where SalesAmount is greater than 1000 in the above Sales table.
Step 1: Load the dataset into Power BI
This is how the table looks in Power BI
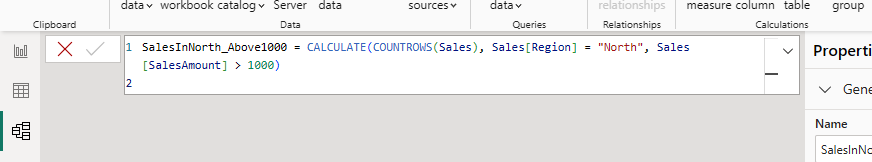
Step 2: Write DAX Formula
SalesInNorth_Above1000 = CALCULATE(COUNTROWS(Sales), Sales[Region] = "North", Sales[SalesAmount] > 1000)
- COUNTROWS(Sales) is used to count the number of rows in the Sales table.
- CALCULATE is used to filter the rows to count only where both conditions are true.
- Sales[Region]=”North”.
- Sales[SalesAmount]>1000.
Step 3: Result
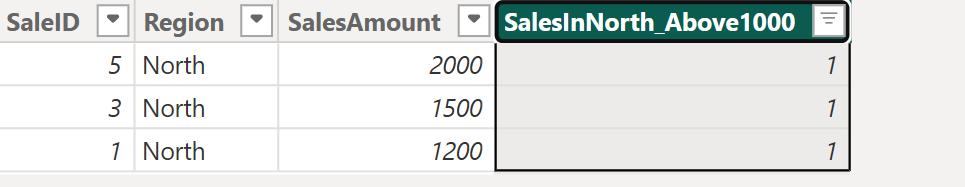
Only these 3 rows meet both conditions: Region “North” and SalesAmount>1000.
Power BI COUNTIF (DAX) vs Excel COUNTIF
| Feature | Power BI (DAX) COUNTIF Equivalent | Excel COUNTIF |
| Function type | It is not a built-in function and is calculated with the help of DAX functions. | COUNTIF is a built-in function in Excel. |
| Ease of Use | It is a bit hard for beginners as it requires writing formulas. | It is very simple to use with the available syntax. |
| Application | It is used as a measure in Power BI reports. | COUNTIF in Excel can be used directly in a cell within a worksheet. |
| Multiple Conditions | It can easily manage multiple conditions using CALCULATE with AND or OR logic | It requires complex formulas to handle multiple conditions |
| Dynamic Updates | The results are updated dynamically based on the context set by slicers or filters in Power BI | COUNTIF is static, so it doesn’t adjust to slicers and filters |
| Performance | Faster performance for large datasets | Its performance is slower for large data but faster for small data |
| interactivity | It supports interactivity with visuals or reports | It doesn’t support interactivity with visuals or reports |
| Aggregation | DAX in Power BI supports aggregation, conditional formatting, and average. | Excel’s COUNTIF doesn’t support aggregation |
| Data Model integration | It can work with complex data across multiple tables in Power BI. | It can only work on data within a single worksheet. |
Precautions When Using DAX for Conditional Counting
- The results of DAX calculations can be changed based on filters or slicers applied, as they are context-dependent. Make sure you understand how the current context affects your calculations.
- Blank values can affect your result, so try to handle this condition by using IF or ISBLANK functions within your DAX formula to prevent inaccurate results.
- Overcomplicated DAX formulas are difficult to debug, so try to keep your formula as short as possible.
- Make sure there is a correct relationship between the tables and that your data is clean. An incorrect relationship between tables may lead to incorrect results.
Best Practices
- Use CALCULATE accurately: CALCULATE changes the context of your data, so make sure to structure your formulas clearly to avoid unexpected results.
- Use Variables: If you have large and complex calculations, try to use variables to store the results of intermediate queries. This will increase performance and readability.
- Performance Optimization: Performance may be affected by large data. Try to avoid complex DAX functions that take time to scan the entire table. Optimize your data model or reduce your table to reduce performance issues.
- Verify Your Calculations: Before using your conditional counting formulas in your actual table. Try to check it once with sample data. Make sure that the results are expected.
Get 100% Hike!
Master Most in Demand Skills Now!
Conclusion
Excel’s COUNTIF function can be replicated in Power BI with the help of DAX functions, which include CALCULATE, COUNTROWS, and other DAX functions. You can also perform conditional counting and handle complex conditions to create a report. Use of Power BI in conditional formatting may seem more difficult at first, but once you understand the power of DAX, you will see how much more you can achieve compared to Excel.
To learn more about Power BI and its functions, check out this Power BI Course and also explore Power BI Interview Questions prepared by industry experts.
COUNTIF Function in Power BI – FAQs
Q1. What is DAX in Power BI?
DAX (Data Analysis Expressions) is a library of functions or operators in Power BI that are combined to perform complex calculations.
Q2. What is COUNTIF in Excel?
COUNTIF in Excel is a function that is used to count the number of cells within a range that meet specified conditions.
Q3. How do I replicate COUNTIF in Power BI?
You can replicate COUNTIF in Power BI by using the DAX functions like CALCULATE and COUNTROWS.
Q4. How do I count rows with multiple conditions in Power BI?
You can use CALCULATE with multiple conditions to apply AND logic.
Q5. What is the syntax of COUNTIF in Power BI?
The Syntax of COUNTIF in Power BI:
NewMeasure = CALCULATE(COUNTROWS(Table), Condition)